How Central Asia’s Industrial Map Has Changed Over 30 Years
Over the past three decades, Central Asia has followed two different industrial paths: resource-led economies built around oil and gas, and emerging manufacturing bases shaped by reform, investment, and infrastructure.
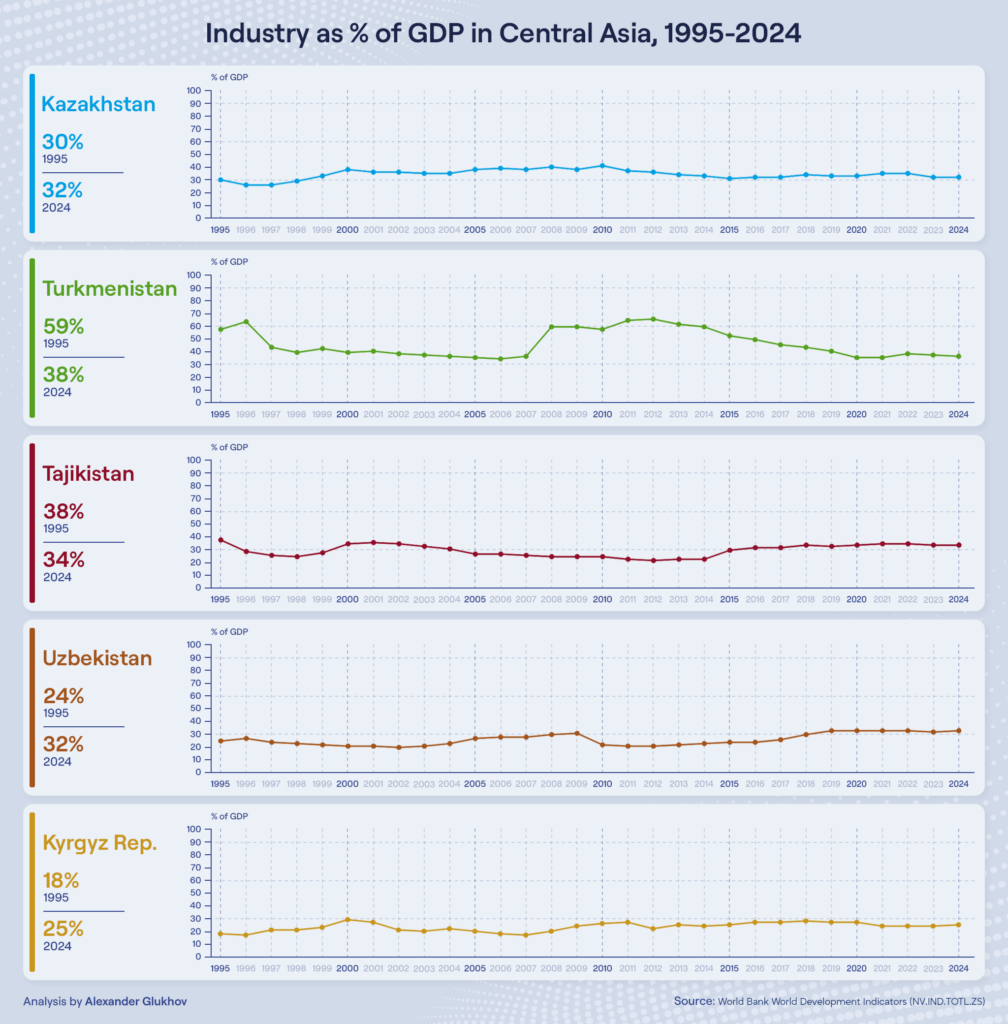
All five Central Asian countries inherited a relatively high industrial share from the Soviet period, though the quality and structure of that inheritance differed significantly. Turkmenistan started at 59% in 1995, almost entirely driven by gas. Tajikistan stood at 38%, with aluminum, cotton, and mining, although against the backdrop of civil war these assets were closer to ruins than functioning industrial capacity. Kazakhstan had 30%: oil was already there, but export infrastructure was not yet fully operational. Uzbekistan began at 24%, while Kyrgyzstan stood at 18%.
In 1996, Turkmenistan briefly jumped to 65% as gas exports revived. But by 1997 the figure had collapsed to 45%. In 1994, Gazprom had stripped Turkmenistan of its quota for access to European routes, while payment for deliveries to CIS countries, mainly Ukraine through the Russian pipeline system, regularly failed to arrive. In March 1997, Ashgabat halted exports through the Russian system. Formally, this was Turkmenistan’s decision, but in substance it was a reaction to the absence of alternative routes. The country found itself in a trap: the only transit operator could shut the tap at any moment.
The early 2000s reshaped the regional balance. Kazakhstan began a sustained climb, from 33% in 1999 to 40% in 2008. Tengiz reached its design capacity, Kashagan was being prepared for launch, and oil prices were rising. During this period, Kazakhstan transformed from a post-Soviet periphery into one of Eurasia’s key oil exporters. In 2008, industry accounted for 40% of GDP, the country’s historical maximum.
Turkmenistan moved in the opposite direction in the same period, declining from 41% in 2000 to 36% in 2006. Paradoxically, gas extraction continued to grow, but GDP grew faster due to construction and services. In 2006, a framework gas agreement was signed with China; in 2007, specific commercial contracts followed; and in December 2009, the first pipeline from Central Asia to China opened. This changed the architecture of Turkmen gas exports.
Tajikistan also reduced its industrial share during those years, from 35% in 2000 to 26% by 2007. The reason was not classic deindustrialization, but the faster growth of construction and trade. The Tajik Aluminum Plant, known as TALCO and called TadAZ until 2007, remained the country’s only major industrial enterprise. It continued operating, but with chronic underinvestment, 1970s-era equipment, tolling disputes with raw material suppliers, and dependence on imported alumina.
Kyrgyzstan fluctuated between 17% and 22%. Its industrial share depended heavily on Kumtor, which either delivered a surge or dragged the figure down depending on production cycles, legal disputes, and tax conflicts between the government and Centerra Gold.
On the chart, 2008 looks like a rupture for Turkmenistan: the industrial share rose from 38% in 2007 to 61% in 2008, a jump of 23 percentage points in a single year. This was not a real economic leap, but rather a reflection of revised national accounts against the backdrop of peak global gas prices. Starting in 2008, Russia began buying Turkmen gas under a formula tied to European prices, and Turkmenistan’s statistics were revalued to reflect the new revenue.
What followed, however, was real. In April 2009, an explosion on the main export pipeline to Russia halted deliveries. By the end of that year, the gas pipeline to China came online. Moscow left as the monopoly buyer; Beijing arrived and locked in a new dependence for decades to come.
In 2011 and 2012, Turkmenistan reached its absolute peak: 66% and 67%. This remains the historical maximum for the entire region over the past 30 years. By that point, China was buying Turkmen gas in volumes Russia had never absorbed.
Kazakhstan during the same period remained within the 34–41% corridor. Kashagan’s launch was postponed repeatedly due to technical accidents, pipe corrosion, and disputes with the consortium. These delays held back growth in the industrial share, but did not undermine Kazakhstan’s overall position.
The year 2014 became a turning point for the entire region. Oil prices fell by half. Kazakhstan’s industrial share slipped from 33% in 2014 to 31% in 2015, while the devaluation of the tenge in 2015 and 2016 hit purchasing power and consumer demand.
Turkmenistan also moved downward, from 61% in 2014 to 54% in 2015 and 51% in 2016. China began pressing on the price of gas, using its position as the sole major buyer. The strategy of moving away from dependence on Russia had turned into a new dependence on China.
Uzbekistan’s story is more complex than the standard “Mirziyoyev reforms” narrative suggests. The chart shows the industrial share at 23% in 2016, 25% in 2017, 29% in 2018, and 32% in 2019. The start of growth does coincide with Shavkat Mirziyoyev’s arrival in December 2016 and the liberalization of the exchange rate in September 2017. However, the 32% level by 2019 also reflects the post-Karimov revision of statistics and the rising weight of certain industries in comparable prices.
That said, real investment inflows were genuine. Textiles, chemicals, and the automotive industry attracted foreign capital. According to the World Bank, manufacturing proper reached 18.9% of GDP in Uzbekistan by 2023, noticeably higher than in Kazakhstan, where it has remained around 12–13%. This is no longer a resource effect, but a structural shift, even if it began from a low base.
After 2015, Kazakhstan stabilized in the 32–35% range. Oil remains the foundation, but its share inside industry is not growing. Diversification efforts through industrialization programs have produced uneven results. By absolute volume of industrial output, Kazakhstan remains the clear Central Asian leader thanks to the scale of its oil and gas sector. But in terms of manufacturing as a share of GDP, it now trails Uzbekistan.
The 2020 pandemic barely changed industrial shares. Every country contracted in GDP terms, but the structure largely held. The main exception was Kyrgyzstan, where GDP fell by around 7% in 2020, while Kumtor was disrupted and the mining share became unstable.
By 2024, the regional picture looks as follows:
Turkmenistan – 38%
The decline from the 2011–2012 peaks continues. Gas dependence on China has reached a critical level, while alternative export routes still do not exist.
Kazakhstan – 32%.
Stable, but stagnant. Industry is diversifying in specific segments, including copper, ferroalloys, and uranium. By volume, Kazakhstan remains the industrial leader of Central Asia, but structurally it is still a resource economy.
Uzbekistan – 32%.
Uzbekistan has matched Kazakhstan in overall industrial share, but with a fundamentally different structure: more manufacturing, less extraction. According to official statistics, industrial output growth in 2025 came in at around 7%, against GDP growth of 7.7%.
Tajikistan – 32%.
The growth of recent years is tied to the construction of the Rogun hydropower plant and to mining. According to official Dushanbe data, industrial output grew by 20% in 2024, the highest rate in the region. EBRD estimates for the first half of 2024 are more modest, at around 13%, but mining still rose by 24%.
Kyrgyzstan – 25%.
Kyrgyzstan remains the lowest in the region. Kumtor came under state management in 2021 and the process was finalized in 2022 after the arbitration settlement with Centerra. Without Kumtor, the country’s industrial share would be significantly lower.
The bottom line
Over 30 years, Central Asia has split into two industrial tracks.
Kazakhstan and Turkmenistan remain resource economies with a high industrial share, but they are vulnerable to energy prices and dependent on one or two export markets. Uzbekistan is building a more diversified industrial base. This process is slower and more uneven than official narratives suggest, but in manufacturing share Uzbekistan has already overtaken Kazakhstan.
Tajikistan is industrializing from a low base, relying on hydropower and mining. Kyrgyzstan remains the most vulnerable economy in the region: much of its industrial picture still depends on a single asset.
Latest news
Our latest stories in focus.